


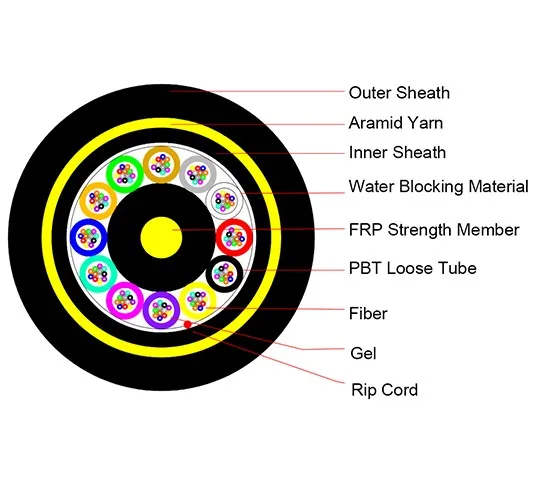
Note: This is a structural diagram of the GYXTW optical cable.
Have you ever wondered how a video call from the other side of the globe reaches you almost instantly? The answer lies beneath our feet and over our heads, in a vast network of hair-thin glass fibers. At the heart of understanding this marvel of modern engineering is the fiber optic cable diagram. These diagrams are the essential blueprints that reveal how light is trapped and guided over vast distances, enabling our digital world. This article will decode these diagrams, explaining the layered structure of a cable, the core science of light guidance, and the different designs tailored for specific tasks.
The Basic Blueprint: Anatomy of a Fiber Optic Cable
A fiber optic cable is much more than a single strand of glass. It is a sophisticated, multi-layered assembly designed for maximum protection and performance. The diagram below breaks down this structure from the inside out.
At its absolute center is the core. This is the pathway for light, an ultra-pure glass or plastic filament with a diameter as fine as 5 to 75 micrometers (for multimode fiber). Surrounding the core is the cladding, a layer of glass with a deliberately lower refractive index (n2) than the core (n1). This difference (n1 > n2) is the fundamental principle that allows the cable to function, causing light to reflect back into the core in a process called total internal reflection.
These two elements—core and cladding—form the "bare fiber." To protect this delicate glass pair, a primary coating (a soft plastic layer like acrylate) is applied immediately. Finally, the entire assembly is bundled with strength members (like aramid yarn) and encased in a tough outer jacket, forming the durable cable we handle during installation.
The Science in the Diagram: Refractive Index Profiles
Not all light signals are the same, and neither are all fibers. The key design difference is captured in a specific type of diagram: the refractive index profile. This graph shows how the refractive index changes across the fiber's radius, and it determines how data pulses travel.
1. Step-Index Multimode Fiber: The diagram shows a simple, sharp step at the core-cladding boundary. This design is cost-effective but allows light rays (modes) to travel many different paths. These paths have different lengths, causing pulses to spread out over distance, which limits bandwidth and range. It's best for short-distance transmission.
2. Graded-Index Multimode Fiber: Here, the diagram shows a smooth, parabolic curve. The refractive index is highest at the center and gradually decreases toward the cladding. This curve bends light rays inward, smoothing their paths and reducing pulse spreading. It offers a performance middle ground for intermediate distances.
3. Step-Index Single-Mode Fiber: The profile shows a sharp step, but with a crucial difference: the core is extremely small (typically 8-10 micrometers). This tiny size allows only a single, straight path for the light—the fundamental mode. The result is exceptionally low signal distortion and loss, making it the standard for high-data-rate, long-distance communications like undersea cables and telecom backbones.
Note: This is a structural diagram of the ADSS-D optical cable.
From Fiber to Cable: Diagrams of Real-World Applications
In practical applications, fibers are packaged into cables designed for specific environments. Diagrams for these cables show complex, integrated structures.
1. Hybrid Fiber-Optic Cables: A common design in networking is the hybrid cable. A technical cross-section reveals optical fibers alongside copper power conductors within a single jacket. This allows a device like a wireless access point to receive both data (via light) and electrical power through one cable, drastically simplifying installation.
2. Specialized Composite Cables: For extreme environments, diagrams get even more specialized. The OPGW (Optical Ground Wire) cable, used on high-voltage power line towers, shows a central fiber unit protected by layers of aluminum and steel wires. This design allows it to function dually as a lightning shield/ground wire for the power line and a high-bandwidth data conduit, immune to electromagnetic interference from the power current.
How to Find and Use Fiber Optic Cable Diagrams
Whether you are a network engineer, a student, or a curious learner, these diagrams are invaluable resources.
1. Manufacturer Resources: Leading companies like Corning provide extensive, detailed product drawing centers with downloadable diagrams (in PDF, DXF, Visio formats) of their cables and connectivity hardware, essential for planning and installation.
2. Technical Manuals & Standards: Equipment vendors (e.g., H3C, Huawei) include detailed cable and termination diagrams in their product installation guides, which are excellent references for specific application scenarios.
3. Academic & Professional Texts: Textbooks and professional publications use these diagrams to explain fundamental principles, such as the differences in refractive index profiles and their impact on performance.
To sum up
A fiber optic cable diagram is far more than an illustration; it is a visual narrative of physics, engineering, and information theory. From the simple principle of refractive index contrast shown in a profile graph to the complex cross-section of a hybrid composite cable, these diagrams unlock our understanding of high-speed global communication. By learning to read them, you gain insight into the invisible infrastructure that powers the internet, cloud computing, and global connectivity. The next time you experience seamless streaming or a clear video call, remember the intricate blueprints that guide pulses of light, making it all possible.